CPU火焰图常用工具
CPU火焰图
关于性能分析
- On-CPU火焰图: 基于线程在CPU执行上耗时采样,可以直观地查看线程花费在CPU上的时间分布
- Off-CPU火焰图: 基于线程在CPU等待(I/O、锁、中断等原因)上耗时采样,可以直观地查看线程花费在阻塞上的时间分布
一篇关于off-cpu火焰图的入门引导性文章:offcpuanalysis
Off-CPU analysis is complementary to CPU analysis, so that 100% of thread time can be understood. This method also differs from tracing techniques that instrument applications functions that commonly block, since this method targets the kernel scheduler’s notion of blocking, which is a convenient catch-all.
Threads can leave CPU for a number of reasons, including I/O and locks, but also some that are unrelated to the current thread’s execution, including involuntary context switching due to high demand for CPU resources, and interrupts. Whatever the reason, if this occurs during a workload request (a synchronous code-path), then it is introducing latency.
常用工具
arthas
arthas是Alibaba开源的Java诊断工具,其中整合了很多实用的工具,例如查看当前JVM的线程堆栈信息、查看和修改JVM的系统属性、方法执行数据观测、生成火焰图等。最大的优点是对监控应用无代码侵入,也不需要重启监控应用或者添加启动参数就可以随意attach到目标JVM进程然后进行各种操作。
此处重点提到的是arthas中的profiler功能,实际上是对async-profiler的封装,可以对JVM应用进行采样后输出各种类型的火焰图。
使用教程
- 启动arthas
1 | wget https://alibaba.github.io/arthas/arthas-boot.jar |
- 启动profiler采样
1 | # 基于CPU使用率采样(适用于CPU密集型) |
1 | # 基于样本采样,可估算耗时(适用于IO密集型) |
- 获取已采集的sample的数量
1 | $ profiler getSamples |
- 查看profiler状态
1 | $ profiler status |
- 生成svg格式结果
1 | $ profiler stop |
采样事件
async-profiler支持对多种事件做采样分析,例如cpu、alloc、lock、cache-misses等,常用的采样事件为cpu和wall。其中火焰图采样未指定事件时默认对cpu事件进行采样,即On-CPU火焰图,仅包含JVM在CPU执行时的采样,而不包含CPU等待时的采样。
如果需要分析IO密集型应用,比较适合对wall事件进行采样,如下官方描述,wall事件会对所有任意状态的线程进行采样,既包含CPU执行时的采样,也包含了CPU等待时的采样,可以用来更显著地分析线程在各个方法上的耗时分布。
-e walloption tells async-profiler to sample all threads equally every given period of time regardless of thread status: Running, Sleeping or Blocked. For instance, this can be helpful when profiling application start-up time.
demo
1 |
|
cpu事件采样
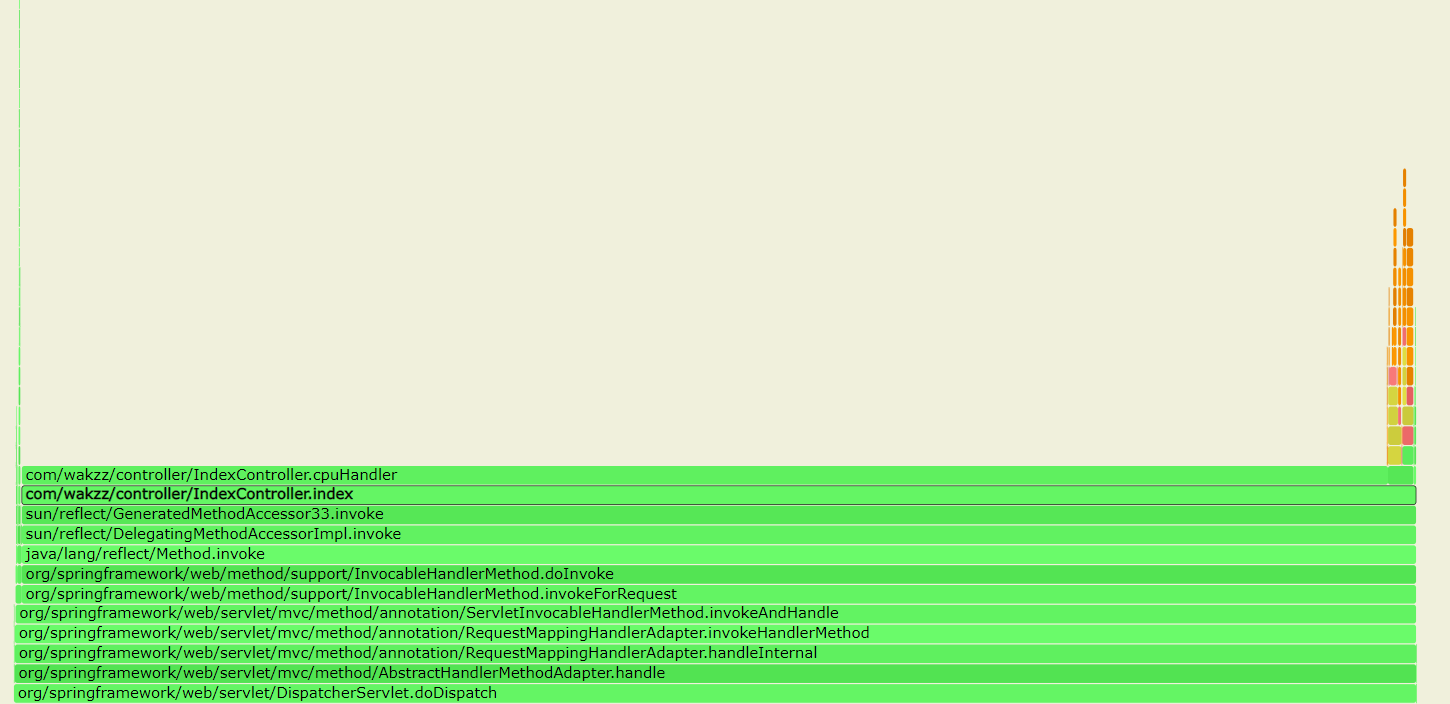
由图可以明细的看出来,index方法中cpuHandler事件采样占比最高,即On-CPU中cpuHandler方法占用的CPU最高。如果因为应用占用CPU消耗高,需要进行优化,那么通过该火焰图很容易分析出来需要对cpuHandler方法优化来降低CPU消耗。
wall事件采样
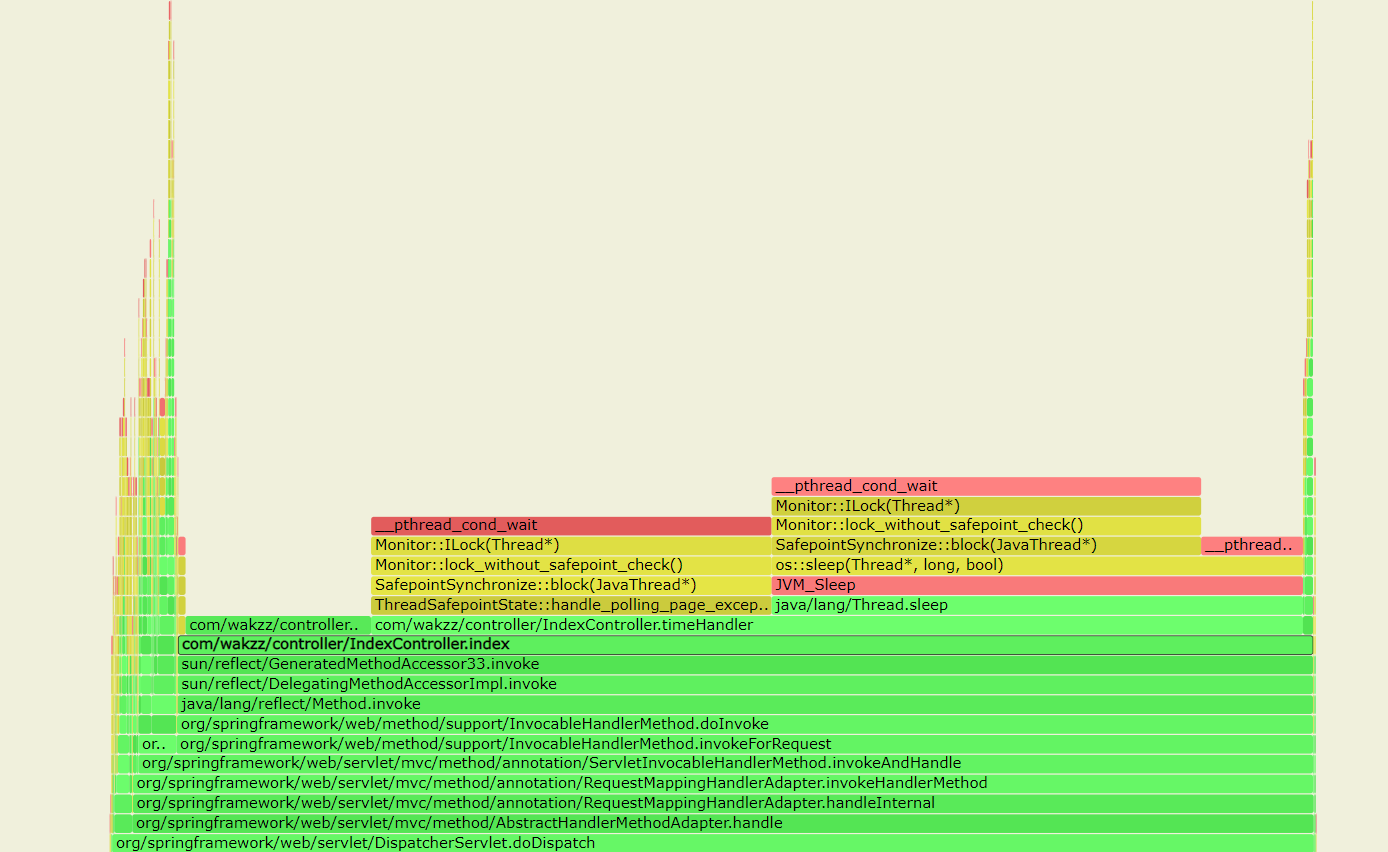
由图可以明细的看出来,index方法中timeHandler事件采样占比最高,即timeHandler方法占用线程耗时时间最高。如果因为index方法耗时较长,需要进行优化,那么通过该火焰图很容易分析出来需要对timeHandler方法优化来降低线程耗时时间。
pprof
pprof是Golang用于可视化和分析配置文件数据的工具。
pprof读取profile.proto格式的分析样本的集合,并生成报告以可视化并帮助分析数据。它可以生成文本和图形报告。
使用教程
1 | curl -so on-cpu.pprof http://127.0.0.1:9090/debug/pprof/profile?seconds=10 |
1 | curl -so pprof.trace http://127.0.0.1:9090/debug/pprof/trace?seconds=10 |
采样事件
pprof中的profile事件实际上就是CPU执行上耗时采样,适合用于分析CPU密集型的耗时分布,或者用于分析应用CPU性能的执行荷载分布。
而pprof中的trace事件虽然官方文档描述如下说是追踪事件,但实际测试下来有点像是Off-CPU的时间分布,但又有有些区别,例如最简单的time.Sleep()睡眠时间并未采集到该事件中。
The package also exports a handler that serves execution trace data for the “go tool trace” command
demo
1 | package main |
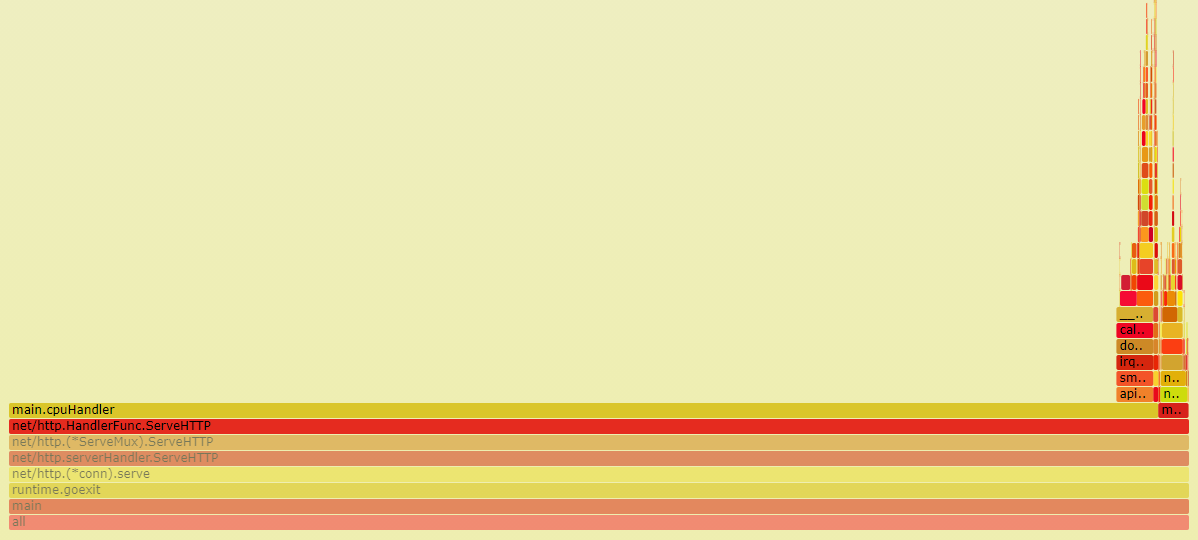
profile事件采样
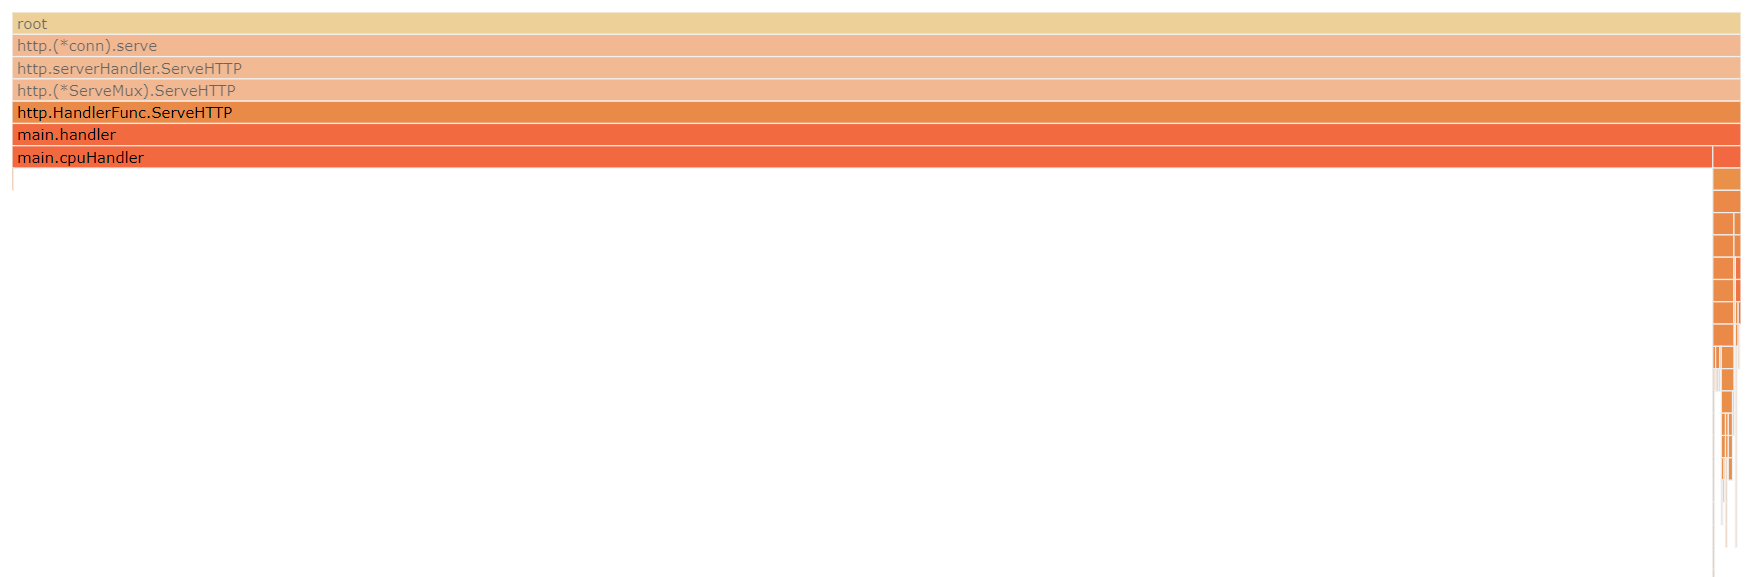
由图可以明细的看出来,handler方法中cpuHandler事件采样占比最高,即On-CPU中cpuHandler方法占用的CPU最高。如果因为应用占用CPU消耗高,需要进行优化,那么通过该火焰图很容易分析出来需要对cpuHandler方法优化来降低CPU消耗。
trace事件采样
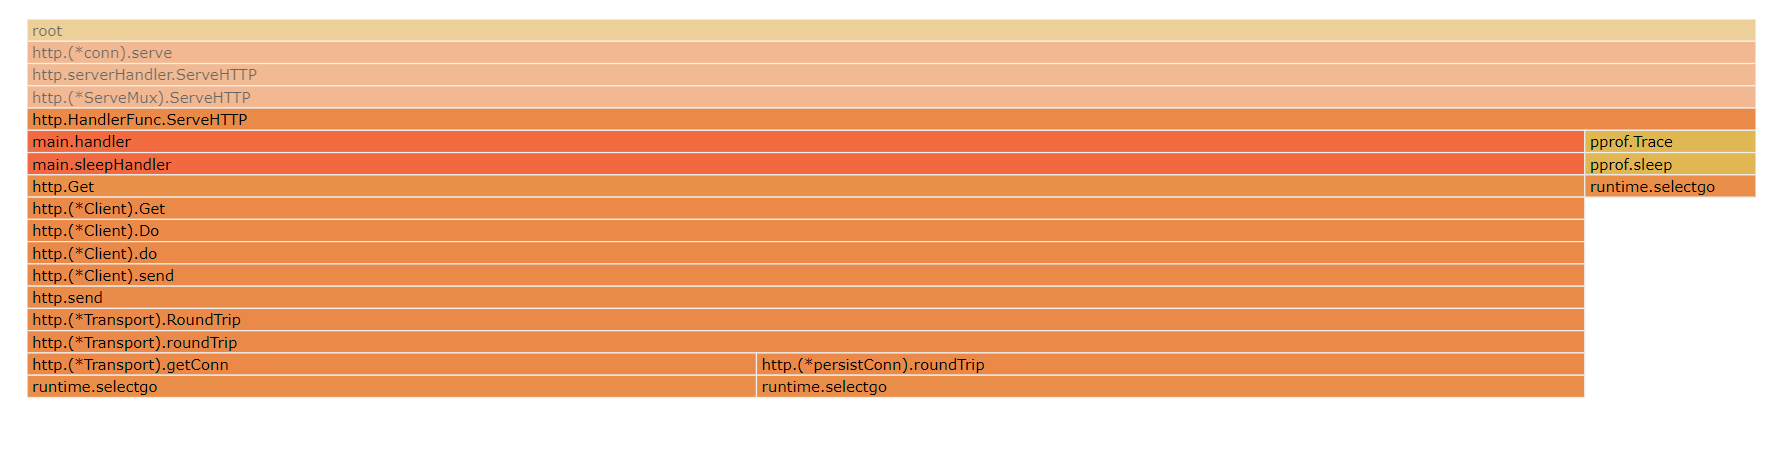
由图可以明细的看出来,handler方法中sleepHandler事件采样占比最高,即Off-CPU中sleepHandler方法占用的CPU等待时间最高。如果因为handler方法耗时久,需要进行优化,那么通过该火焰图很容易分析出来需要优先对sleepHandler方法优化来降低CPU等待耗时。
但由于trace事件采样的局限性,不能展示出线程的耗时分布,因此还需要更多的信息来分析handler方法的耗时原因。
常见错误
当对采集数据进行可视化分析时,如果控制台或者WEB界面输出如下错误,则说明当前机器需要安装graphviz依赖。对于centos快速安装依赖的方式为执行命令:yum install -y graphviz。
1 | [root@localhost ~]# go tool pprof -http=0.0.0.0:6061 ./pprof |
1 | Could not execute dot; may need to install graphviz. |
fgprof
基于Golang官方提供的pprof的内置采集事件只能采集On-CPU时间,第三方库实现了类似于pprof的工具fgprof,可以对Golang的On-CPU和Off-CPU的性能一起提供分析。
使用教程
1 | curl -so fgprof.pprof http://127.0.0.1:9090/debug/fgprof?seconds=10 |
采集事件
fgprof is a sampling Go profiler that allows you to analyze On-CPU as well as Off-CPU (e.g. I/O) time together.
Go’s builtin sampling CPU profiler can only show On-CPU time, but it’s better than fgprof at that. Go also includes tracing profilers that can analyze I/O, but they can’t be combined with the CPU profiler.
fgprof is designed for analyzing applications with mixed I/O and CPU workloads. This kind of profiling is also known as wall-clock profiling.
fgprof的采集事件与arthas中的wall事件类似,都是直接对所有状态的goroutine进行采样,既包含CPU执行时的采样,也包含了CPU等待时的采样,可以用来更显著地分析线程在各个方法上的耗时分布。
demo
1 | package main |
fgprof采样
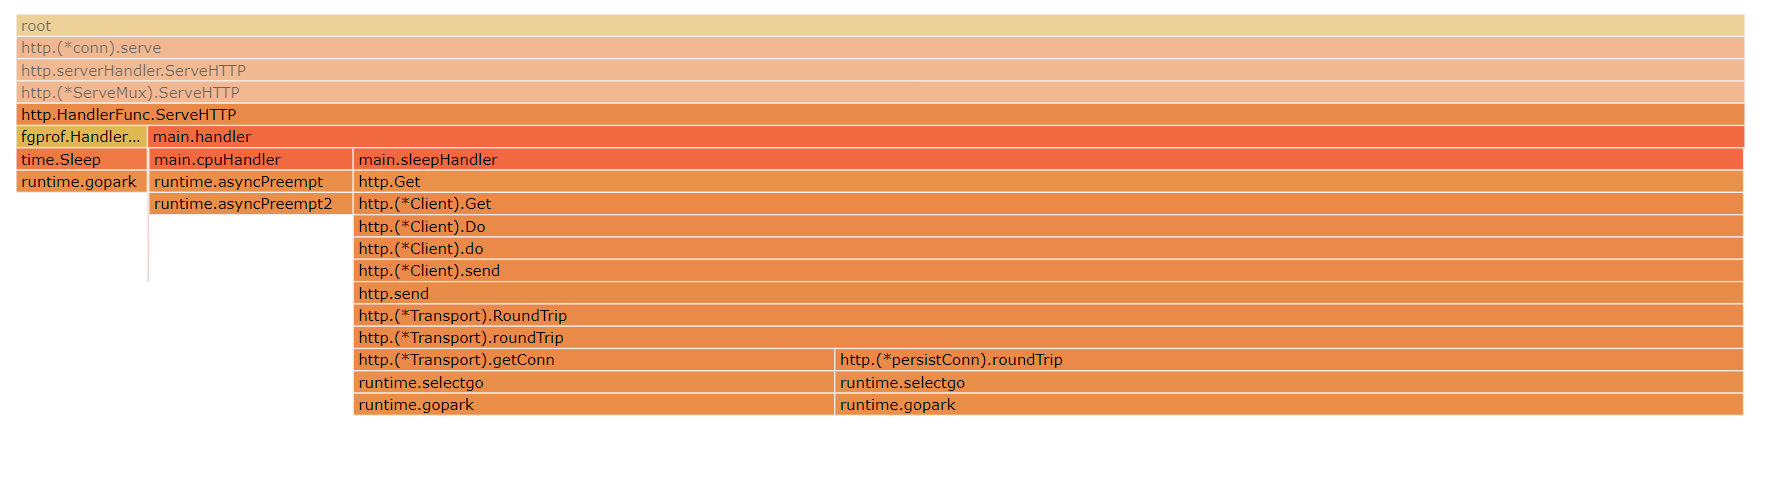
由图可以明细的看出来,handler方法中sleepHandler事件采样占比最高,即sleepHandler方法占用的线程耗时时间最多。如果因为handler方法耗时久,需要进行优化,那么通过该火焰图很容易分析出来需要优先对sleepHandler方法优化来降低线程耗时。
perf
采集事件
使用教程
- 数据采样
1 | // On-CPU采样数据 |
1 | // Off-CPU采样数据 |
- 生成火焰图
1 | git clone https://github.com/brendangregg/FlameGraph |
1 | perf script | ./FlameGraph/stackcollapse-perf.pl | ./FlameGraph/flamegraph.pl > perf.svg |
demo
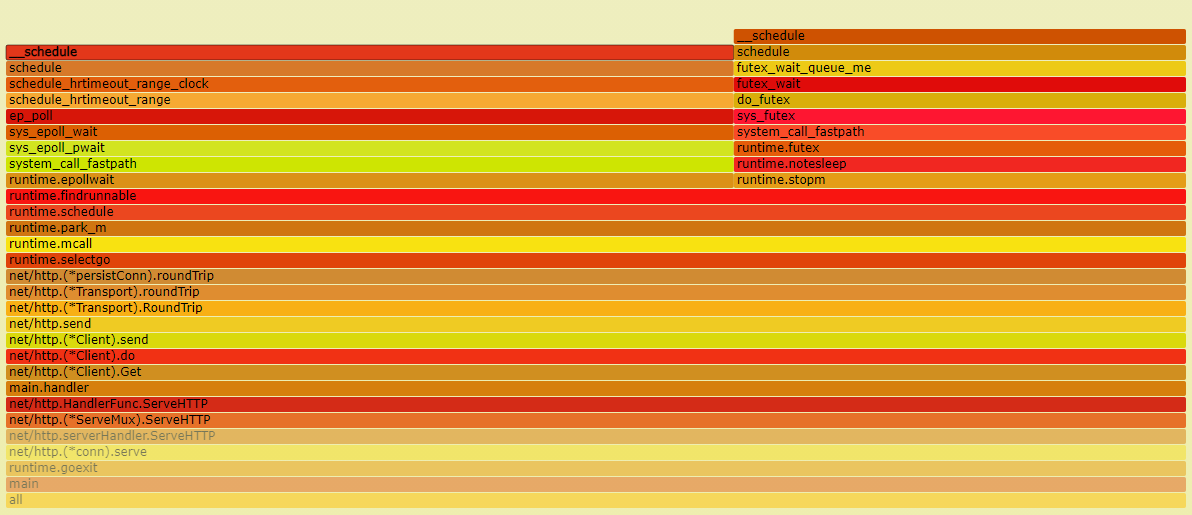
- On-CPU采样
- Off-CPU采样